For our third week of How to Count Birds, we were asked to create a simple data visualization of bird data as well as spend time focusing on the females birds during our weekly observations.
A(n evidently) Familiar Song
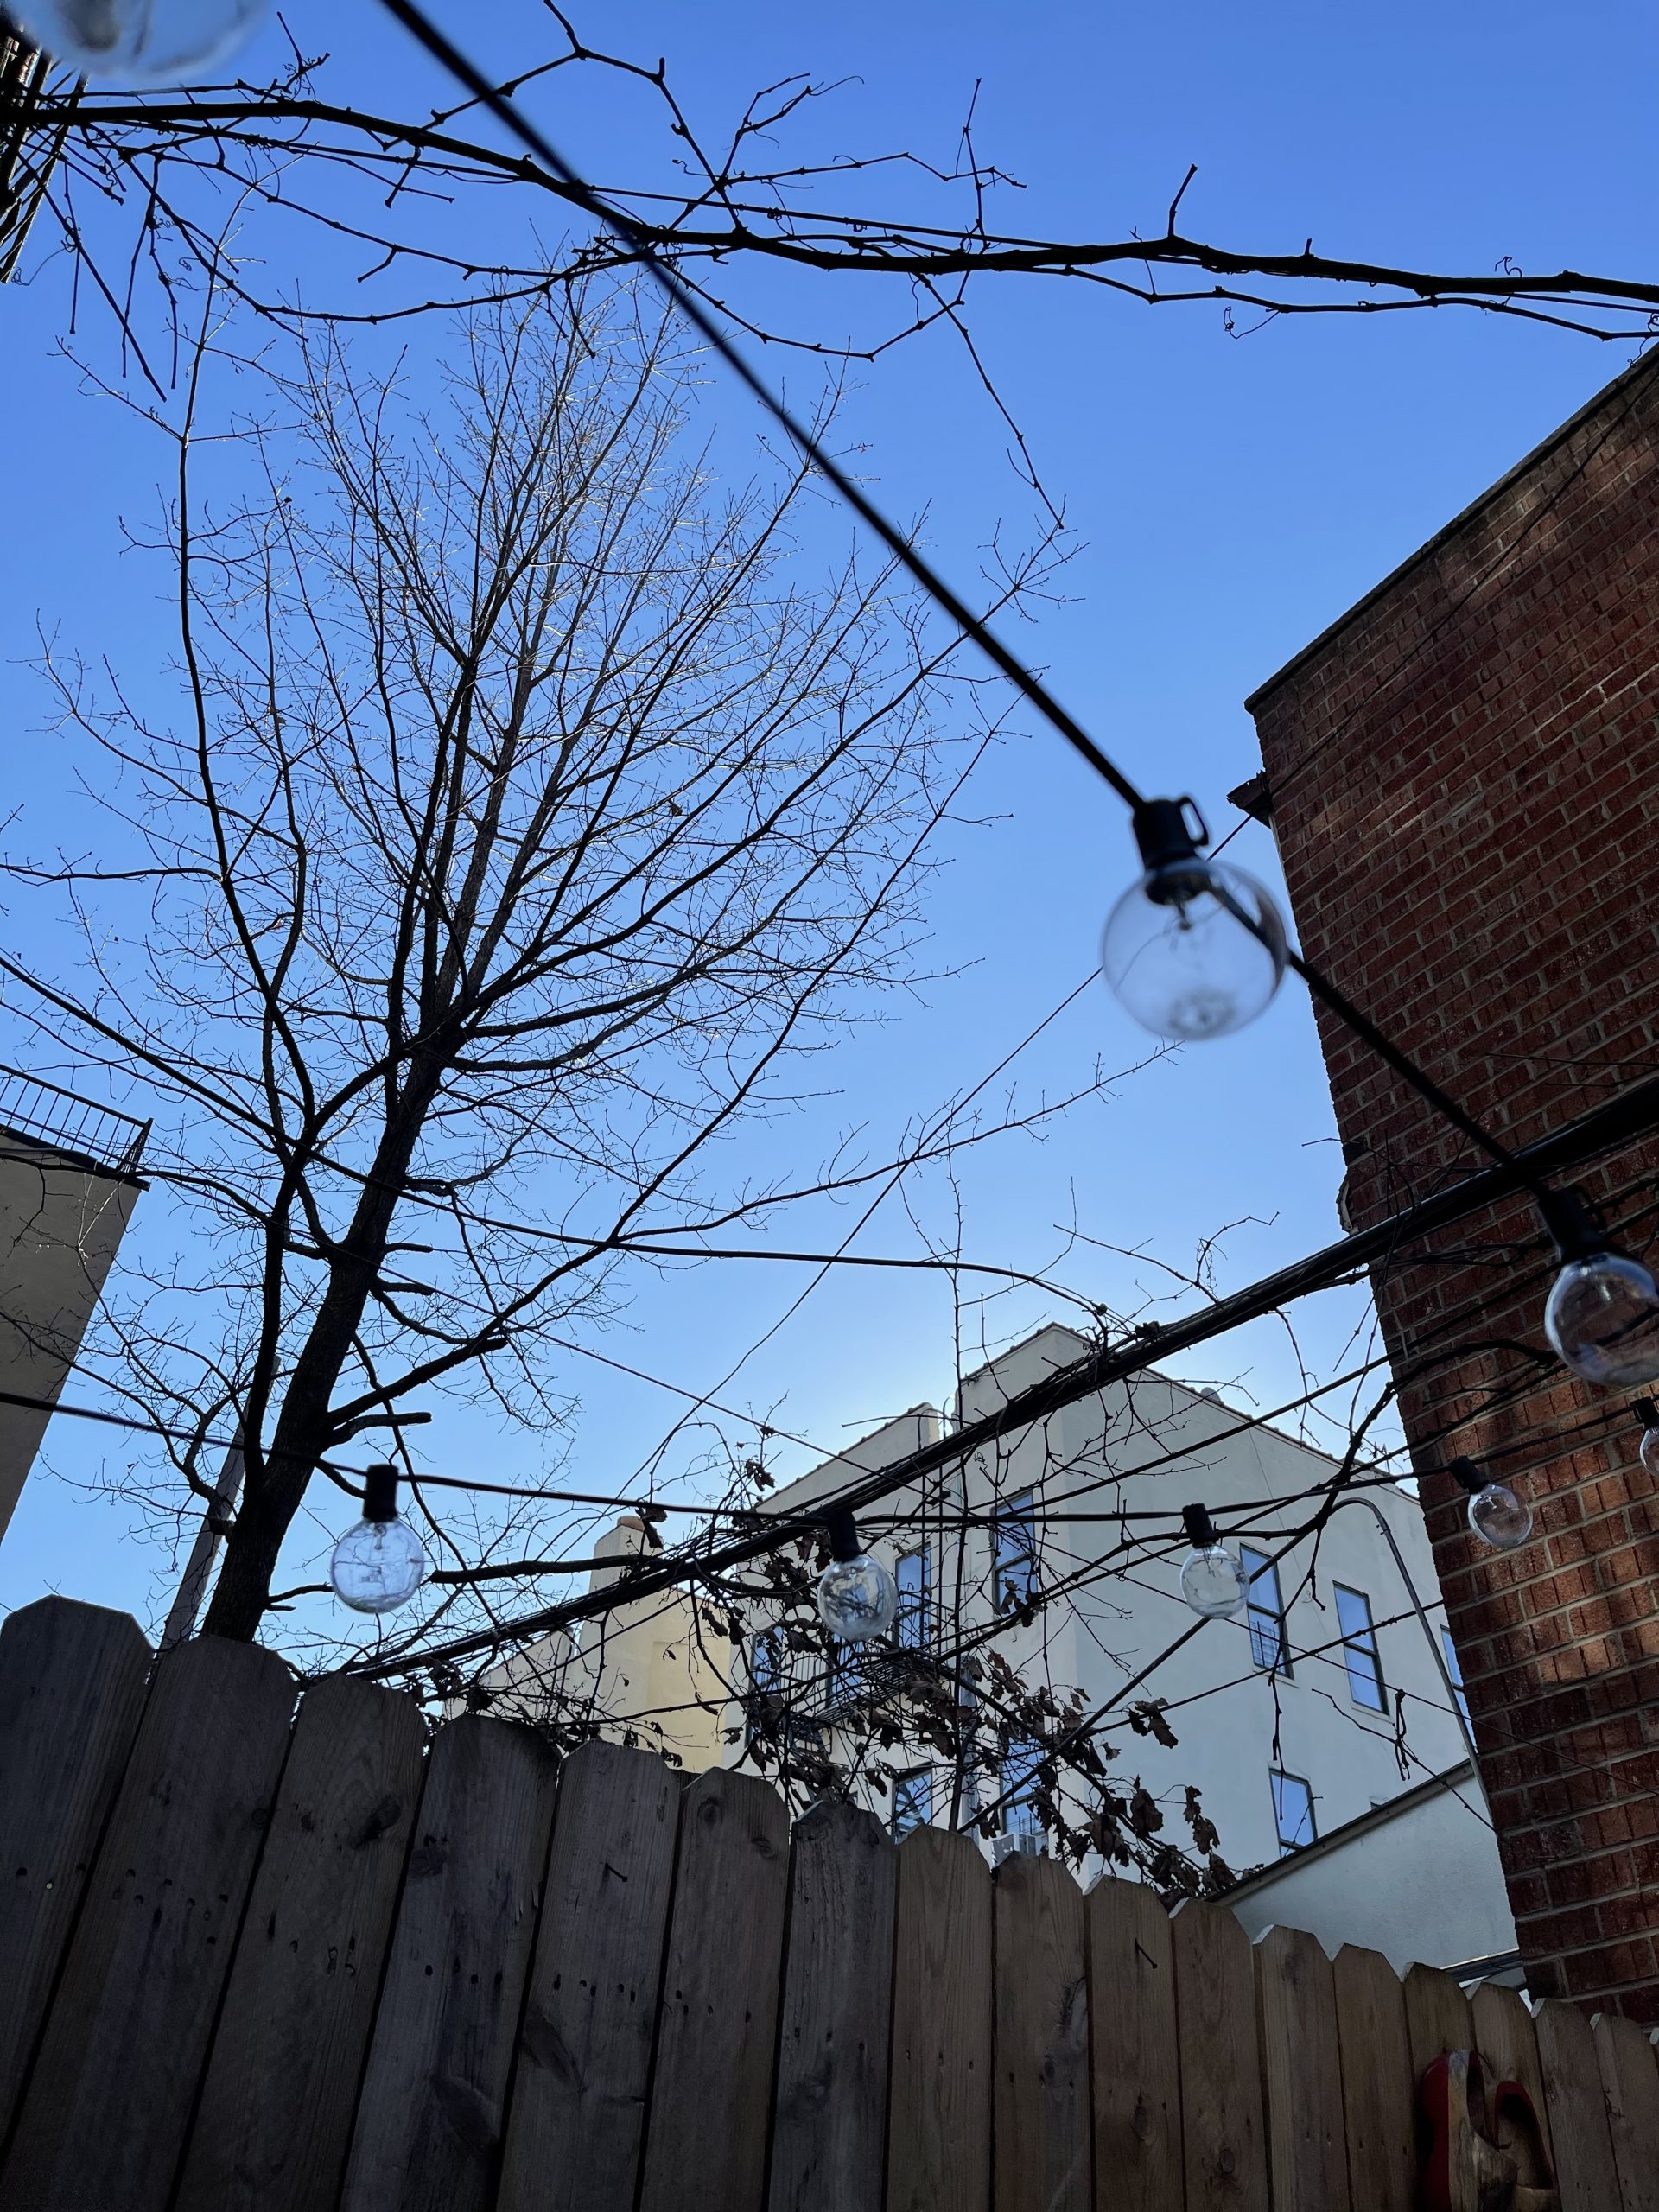
First, the observation stuff. So, I’m a bit limited in my ability to get out and bird watch, I’m almost fully vaccinated, but I’ve also got a hitch in my get-along. (I use a cane.) Remembering from last year the flutter (pun intended) of activity by birds in my back garden/patio area, I picked that area as my patch. In fact, initially kind of made my front and back areas of my home my patch area; however, I’ve noticed that I rarely see a bird in-front.
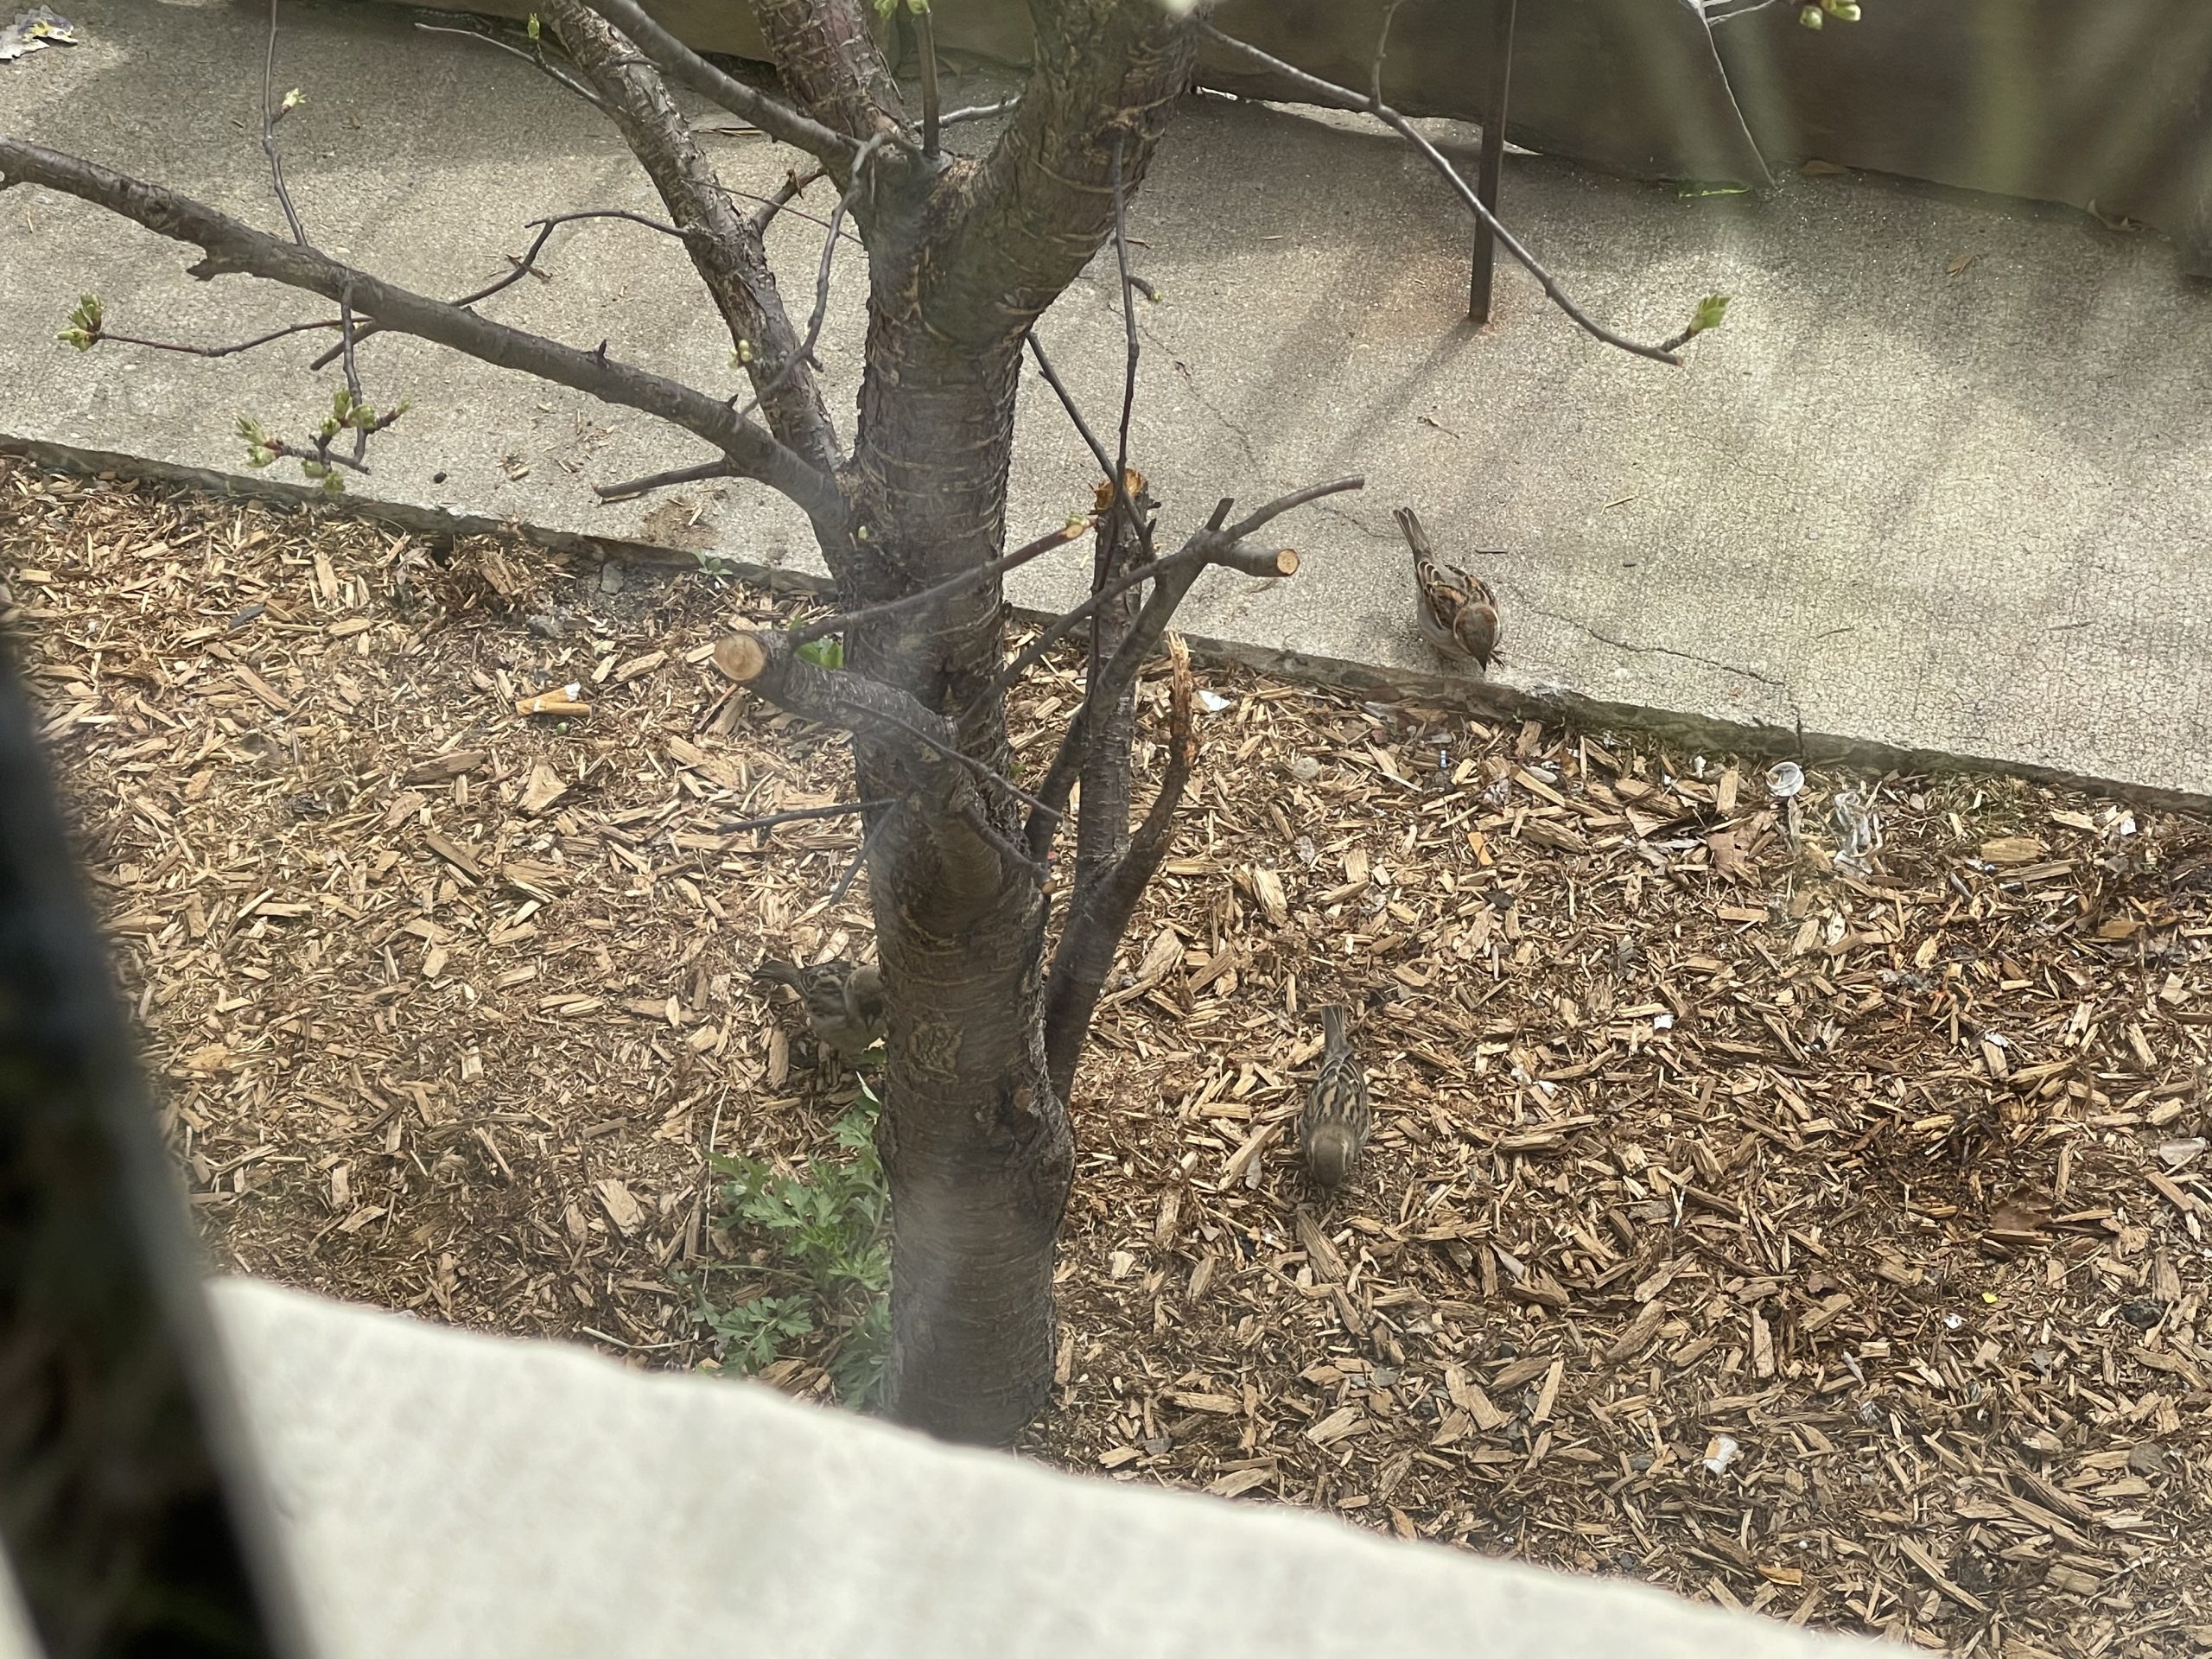
To me, not seeing a bird in the front of a building on a fairly busy street in a very dense city, makes sense when I think about it (in retrospect.) Delivery people, pet owners walking their dogs (and even a cat!), and kids are just a few things I’ve seen out my window that I would imagine make birds wanting to nest (or migrate through an unfamiliar area) uneasy. Yesterday afternoon, I came to the realization that I should probably just count on seeing birds in the back (then I saw a group of house sparrows looking for nesting material below my window out front!)
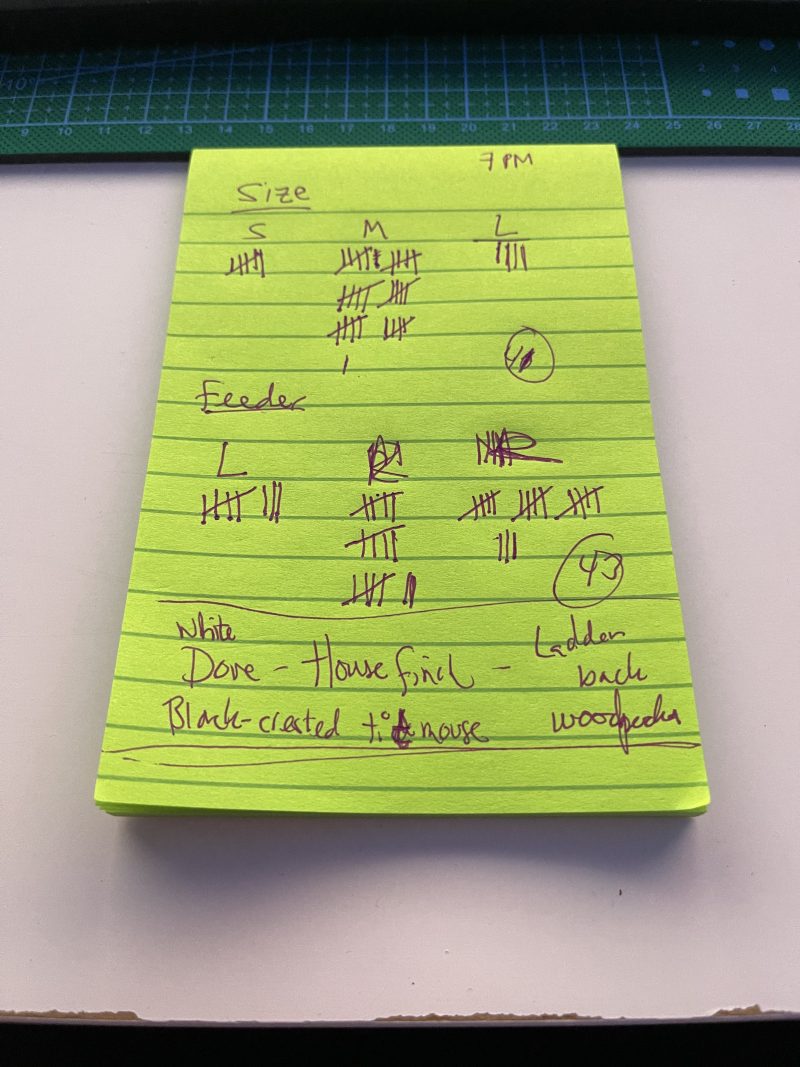
So, I did my observations on Wednesday and Thursday (both great weather days.) Some details about my observations, I did them at 3PM for about 10 minutes each day, then around 5PM the other two days, 15 min on Wednesday and 45 minutes on Thursday. Here’s what I noticed during the earlier, 3PM sessions, which only lasted about 7-10 minutes each day because there wasn’t a ton of activity. Wednesday, I saw one bird fly overhead and heard quite a bit of chirping from the rooftops. Thursday, I saw a bunch of house sparrows fly back and forth between rooftops when I first went outside (and shortly afterward), then a long lull.


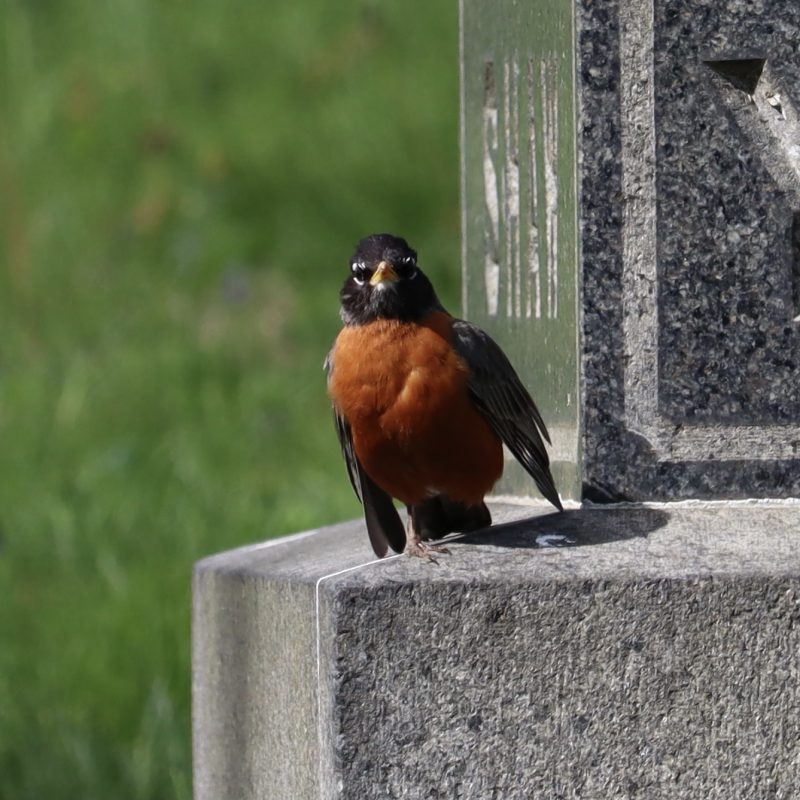
For the record, most of the bird activity in over an hour of watching was sonic. I heard WAY more birds than I saw. Most of them were on rooftops (and possibly fire escapes and tree tops beyond my view.) At first, I really wasn’t sure whether I was seeing male or female birds because of the distance. That said, when I looked into it, it appeared clear that the occasional birds that I saw perched in the tree were likely male due to the fact their underbellies were quite bright white under a dark patch/stripe. The closest I came to (likely) female house sparrows was watching them jump around this morning from my window.

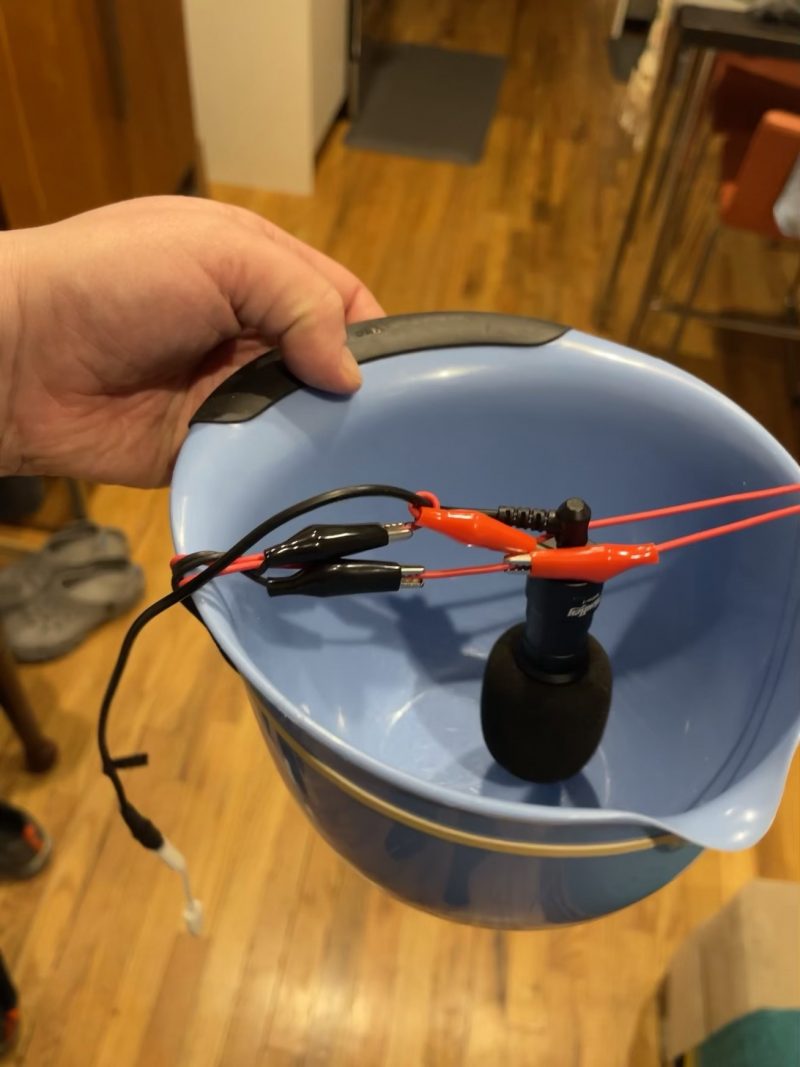
Knowing that bird activity increases in the evening, I went out around five both days. I definitely noticed more activity—among the birds, but traffic as well. It was quite a bit harder to get good audio of birds after 5PM. I haven’t been able to get but one good classification on a bird using the photo feature in Merlin. It identified a very normal looking pigeon as either an owl or a pigeon. That said, I’ve had a ton of luck with using the BirdNET app to identify house sparrows.
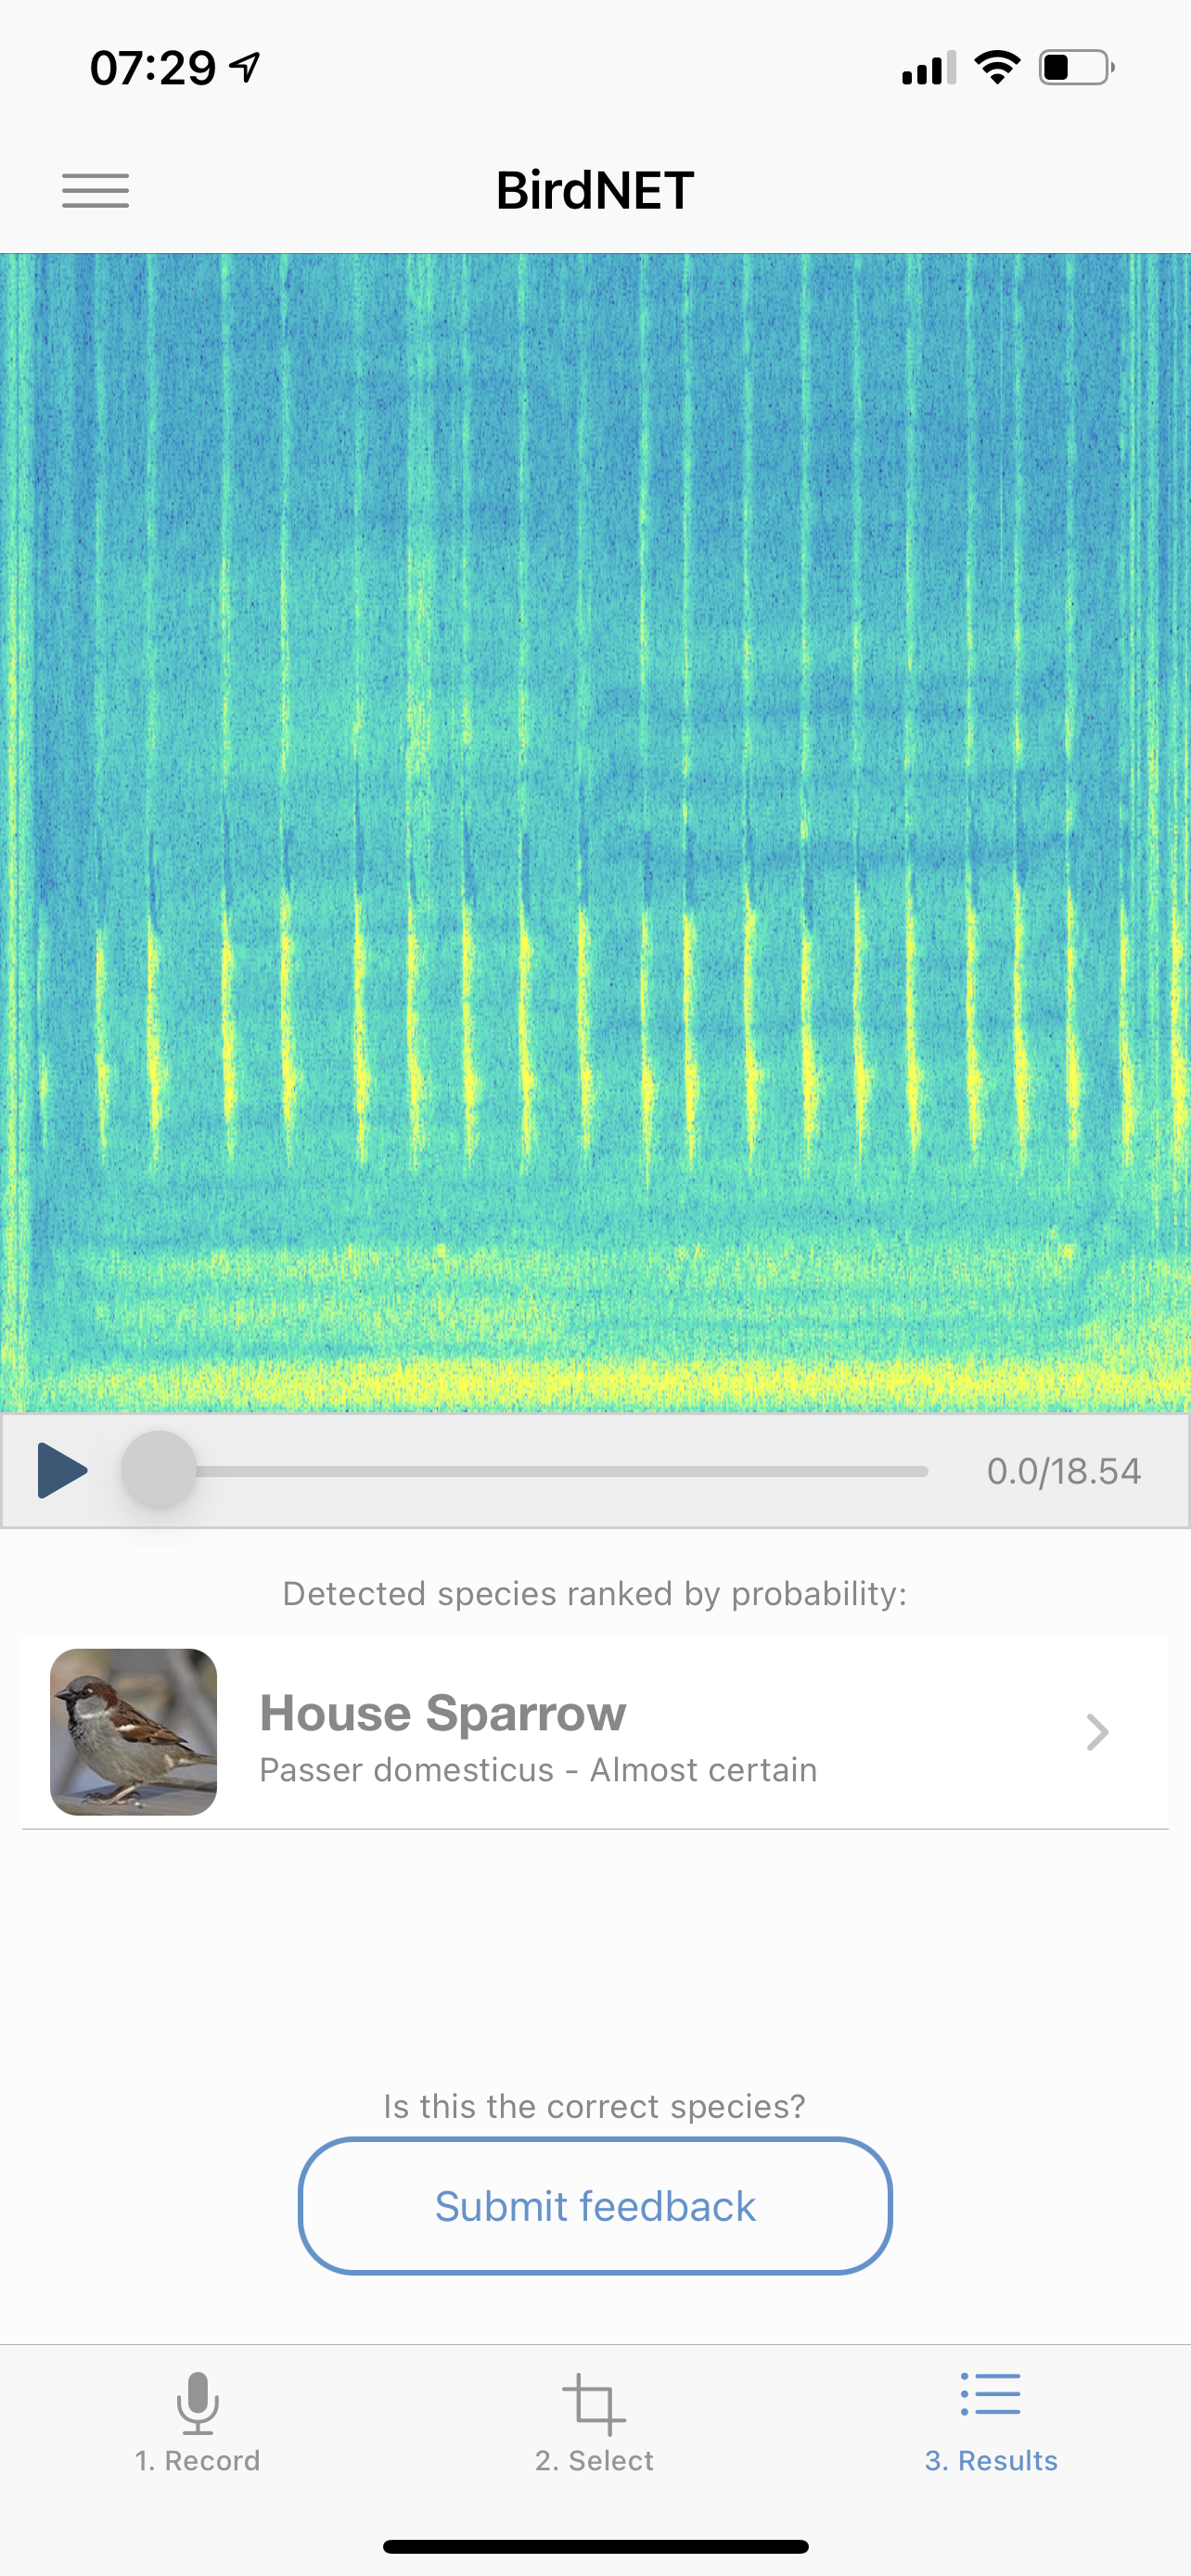
To be fair, it’s completely possible there are other birds making noises around the same time that I’m recording the house sparrows (which are quite loud and chirpy.) I had the PhotoID in Merlin identify a house sparrow as a dark-eyed junco a few times. Wondering what they sounded like, I played the call through the Merlin app (by going to Explore birds and searching for it.) It was clear that it definitely wasn’t that.
Next, and this is where it gets interesting, I played the first of the house sparrow calls in the Merlin app. The one sparrow atop a near tree came down, flew to the yard on the other side of mine, and got very curious! By far the closest he or any birds this season have been! I thought it might be a coincidence, so I played the song again for a sec after the bird returned to the previous position and same thing! VERY COOL!
Though, after doing it, I wondered about the ethics of it… and also about possibly getting my eyeballs pecked out by a bird 1/500th my size (I’m not a fast runner and I’ve seen Birds.) Mostly, though I was wondering if its curiosity might be negatively influencing his behavior… either by playing a potential mating sound (from a female) that’s not there [not knowing whether I was giving him false hope or not] or playing a sound from another male that might indicate territory issues. I figured I’d look into it and ask in class. From what I’ve read, it seems like it’s ok in small spurts, done sparingly while being mindful of present birds’ reactions.
One other thing I noticed that I thought was interesting is that it seems there are ‘waves’ (probably a better word) of bird movement/activity. By this I mean, it seems like the birds were fairly active (for my patch, at this point in the season, that means loud) then it would be quiet for a few minutes. I really only noticed that when I did a session for about 45 minutes continuously. I wonder why that is. Part of me wonders if it’s a reaction to a change in pressure or a sub-(human)sonic sound. It’s possible that a passing predator may also be behind the changes in activity. Just thought that was worth mentioning as well.
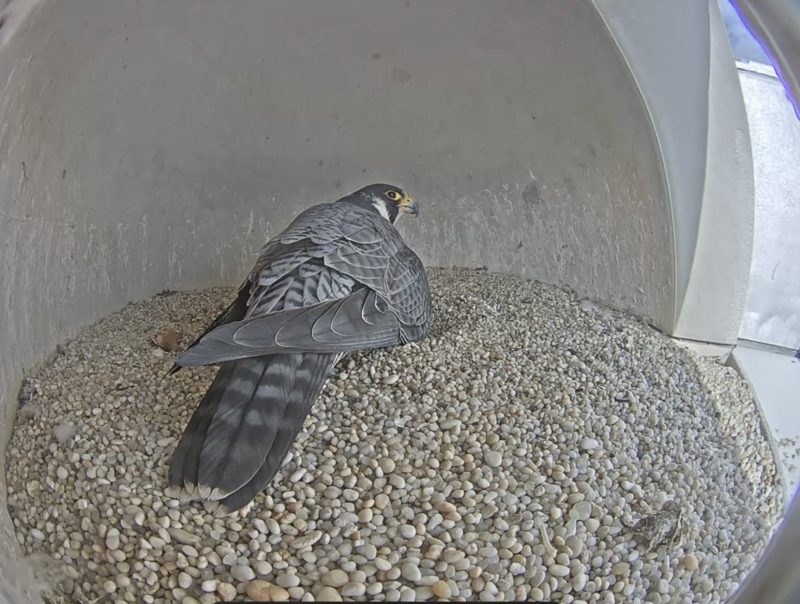
Final count of visually confirmed birds for this week during my sessions: 3 Feral Pigeons and 38 House Sparrows. 0 American White Pelicans.
Statebirds of Martin
As for the data visualization part of this week’s activities, I spent an hour or so downloading data from the Audubon’s Christmas Bird Count Results database and learned a bit about it… It appears that when you download information on a specific count (by year), you’re expected to pick a region and, at least in the states in the US that I checked, select a subregion. If you pick to download information based on species, you can pick the species, then the start and end dates/counts, then pick a region. In this case, you are only able to pick an entire state’s count.
With the evident amount of information available at my finger tips, I thought I’d do a visualization involving state birds for the different states I lived in… but since that’s been quite a few states, I decided to go with the state birds for ages 0 (AL), 5 (TX), 10 (TX), 15 (TX), 20 (MI), 25(TX), 30(CA), 35(TX), and 40(TX). While those ages had me live in 8 different cities, fortunately, it worked out to be only 4 states: Alabama, Texas, Michigan, and California. Respectively, their state birds are the Northern Flicker, Northern Mockingbird, American Robin, and California Quail. I started with the year I was born (1977) and attempted downloading information for 1977 to 2017 for each state bird in each state.
Unfortunately, I kept getting errors and missing information. Essentially, I wasn’t able to get ANY type of successful Excel/PDF/browser view to download for 2016 in Texas (though 1977 to 2015, and, then, 2017 by itself worked. For 2016, I averaged 2015 and 2016, though there appears to be a big drop between 2015 and 2017, so I’m not sure that’s a fair way to do it. (Though I don’t really know a better way.)
I also had issues with the California Quail downloading for 2017… this one didn’t give me any successful result. I just took me to a page that said “EXCEL” when I tried 2017. This one is a bigger issue as doing an average number between the previous two years resulted in a VERY likely inaccurate result—see, 2015 was 22568, but 2016 was less than a quarter at 4138. Something feels up here, but at this point, I feel like documenting this is my best route—I would love to learn better methods for addressing such inconsistencies! This missing data was most frustrating at they came with technical errors.
Unfortunately, for the Northern Flicker (state bird of Alabama, where my father was in the military when I was born), there was over a decade of missing information. For this reason, I decided I should leave it out and do ages in 5 year increments starting at age 5. I thought to have side by side graphs showing all the years provided and highlight the years I lived in those states.
In re-viewing the video from the end of class, the comment about trying to think of ways to show the changes in population from one year to another as being a good activity for us stuck with me. Having worked with data in the past for projects, I know that comparing individual totals as opposed to comparing previous and current cumulative totals, while showing the same data calculated differently (individual years vs combined), can be impactful. I also thought that with some years missing data, if I did an approach where I layered 40 years of results, the imprecise data may not make as much of an impact.
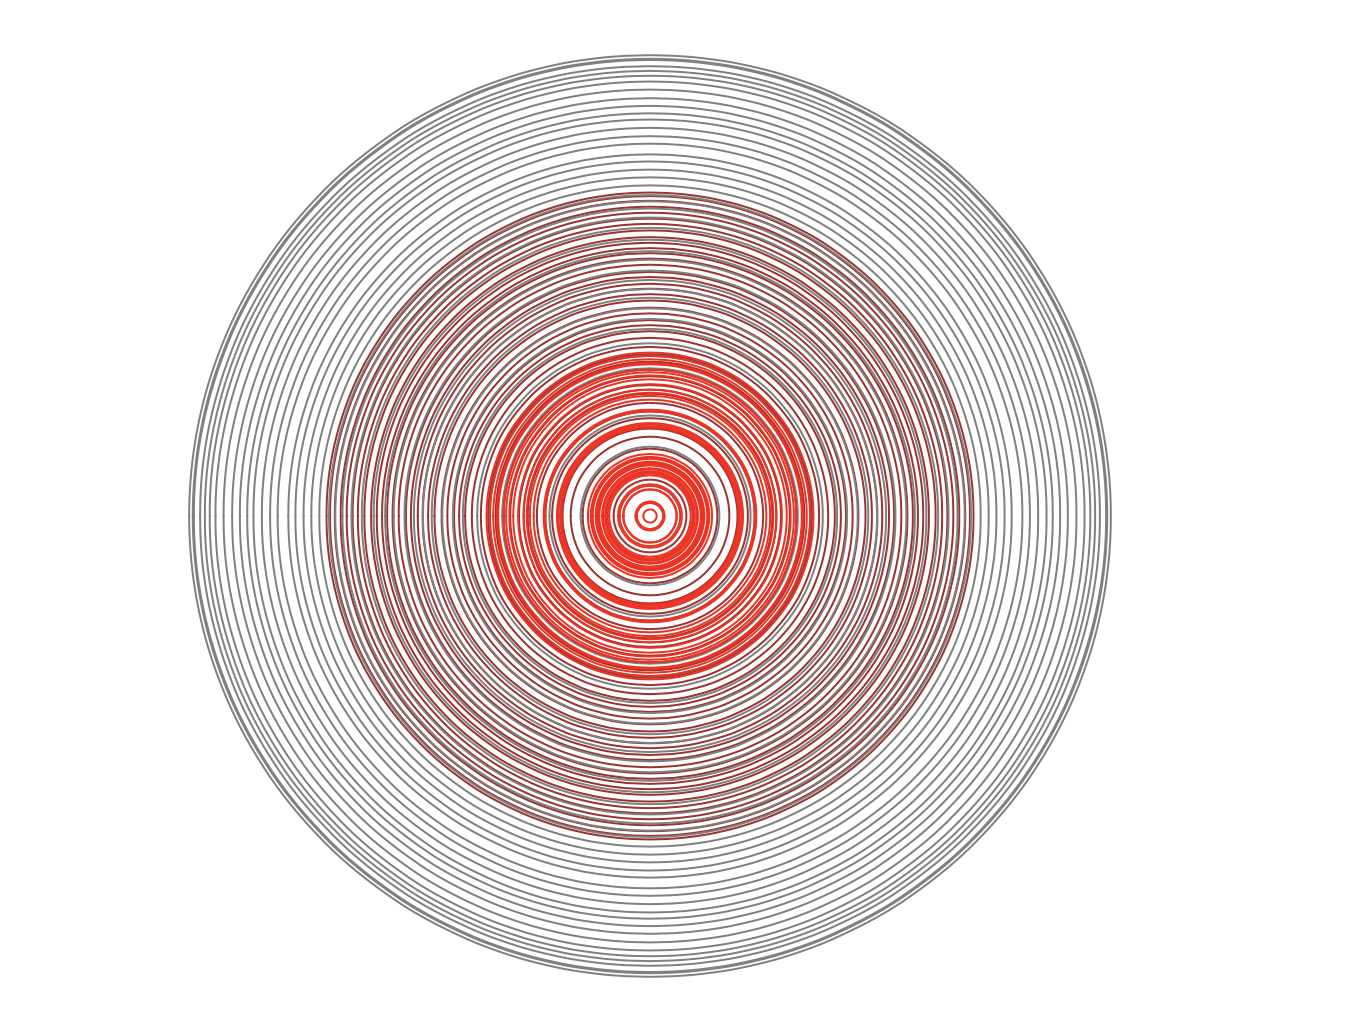
The resulting project is essentially the same data, but with the information of just three different birds (Texas, California, and Michigan…Alabama was left out because of so many missing years of info) inputted. I approached this by having each year, starting with 1977, drawn as a circle with each bird being a different color. I initially wanted to have the circles be filled with different colors, but in order for the circles to be drawn with cumulative counts, overlapping, the newer circles will be drawn on top of the older circles. If there were a fill, the circles drawn on the sketch first wouldn’t be visible.

Here is a link to my final product. To make it, I used the p5 sketch we used for our first visualizations using the CBC count and modified the shape, positioning, and color (among a few other things.) I did two renditions, one with the birds overlapping where one bird is equal to one birds in any of the other species. Below that, I broke out the three different birds and gave them their own circles where viewers could better see the proportional increase vs the previous cumulative total. It would make sense that as more years go on, the less impact the same amount of increase would have. As someone in my mid-40s, I often think about how a month now is certainly less impactful than it was 20 years ago.
Cumulative graphs and data can be tricky to work with. For example, starting with a count from one year can shed light on something’s growth; however, it should be noted that, in these cases the year chosen wasn’t the birth of any of these species, but my birth. I know, very ‘me’-centric, but what in the world isn’t influenced by (oftentimes misunderstood or confusing) biases? At least in my case, I’m being upfront about it (hence the title “Statebirds of Martin.”)
Update – Glitch Video – Bird Box Comparisons
Following along with Jer’s video, I created this Glitch (sketch? application? party??) below showing how to compare different sizes of populations using squares and offsetting. From the walk through, I also learned that dotted edges on shapes are not as simple as calling other built-in p5.js functions, but it’s possible to do with some code you can find on GitHub. (That is something I’d like to learn how to do.)
How to Count Birds – Glitch – Comparison Boxes (changes in population)
As far as the format, I really enjoy watching coders with experience talk through process; I find them very helpful.