So, here is the final time-lapse video for the project!
OeuvReview
I’ve written quite a bit about my project in the past couple of weeks; so, this week, in addition to including the full time-lapse video of 11 days with the seedlings, I’ll also talk about what I’ve done in the last week and include a diagram for the project and a bit of reflection.
First of all, let me recap a bit about the video and what’s going on in it:
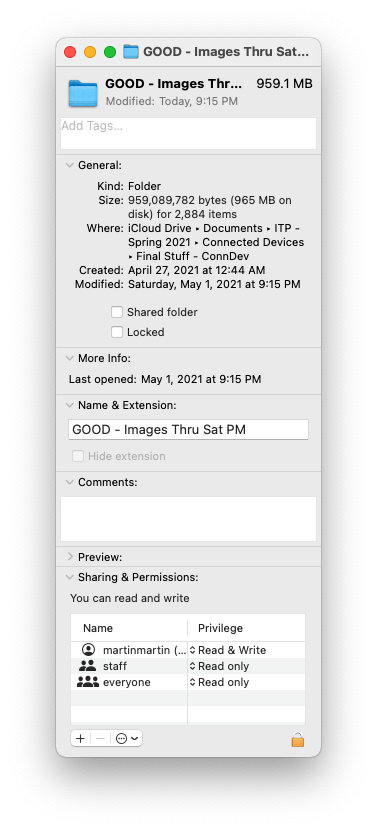
I planted these seedlings just before midnight on Tuesday, 20 Aprl 21—the first photo is from 12:23AM. These photos show some great action by the sprouting seedings starting around the first Friday evening around 7PM and the last image was taken on Saturday, 02 May 21 at 9:10PM. In total, there are 2,884 images in the 4 minute video.
I left the filename in the screen recording so you could see when the photos were taken (and how far part in time they were taken, as the timing was adjustable.) The file names reflect the date and time (GMT.)
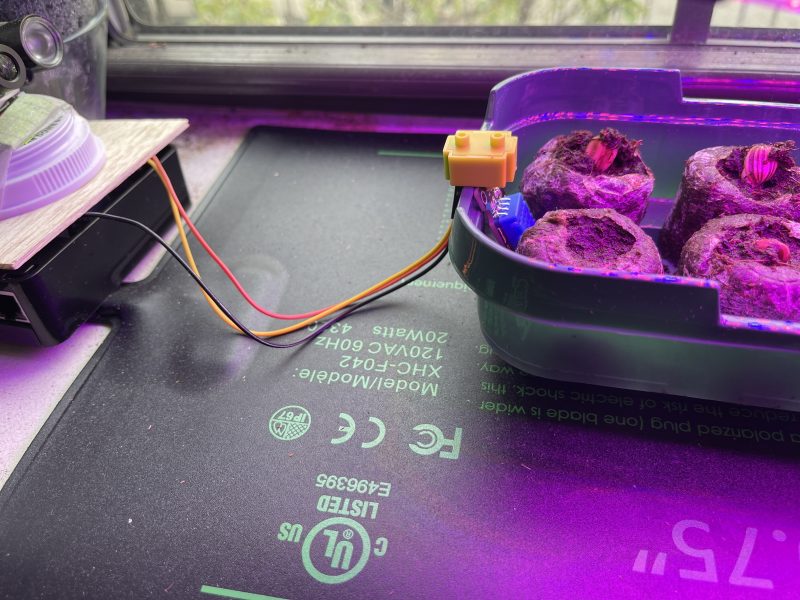
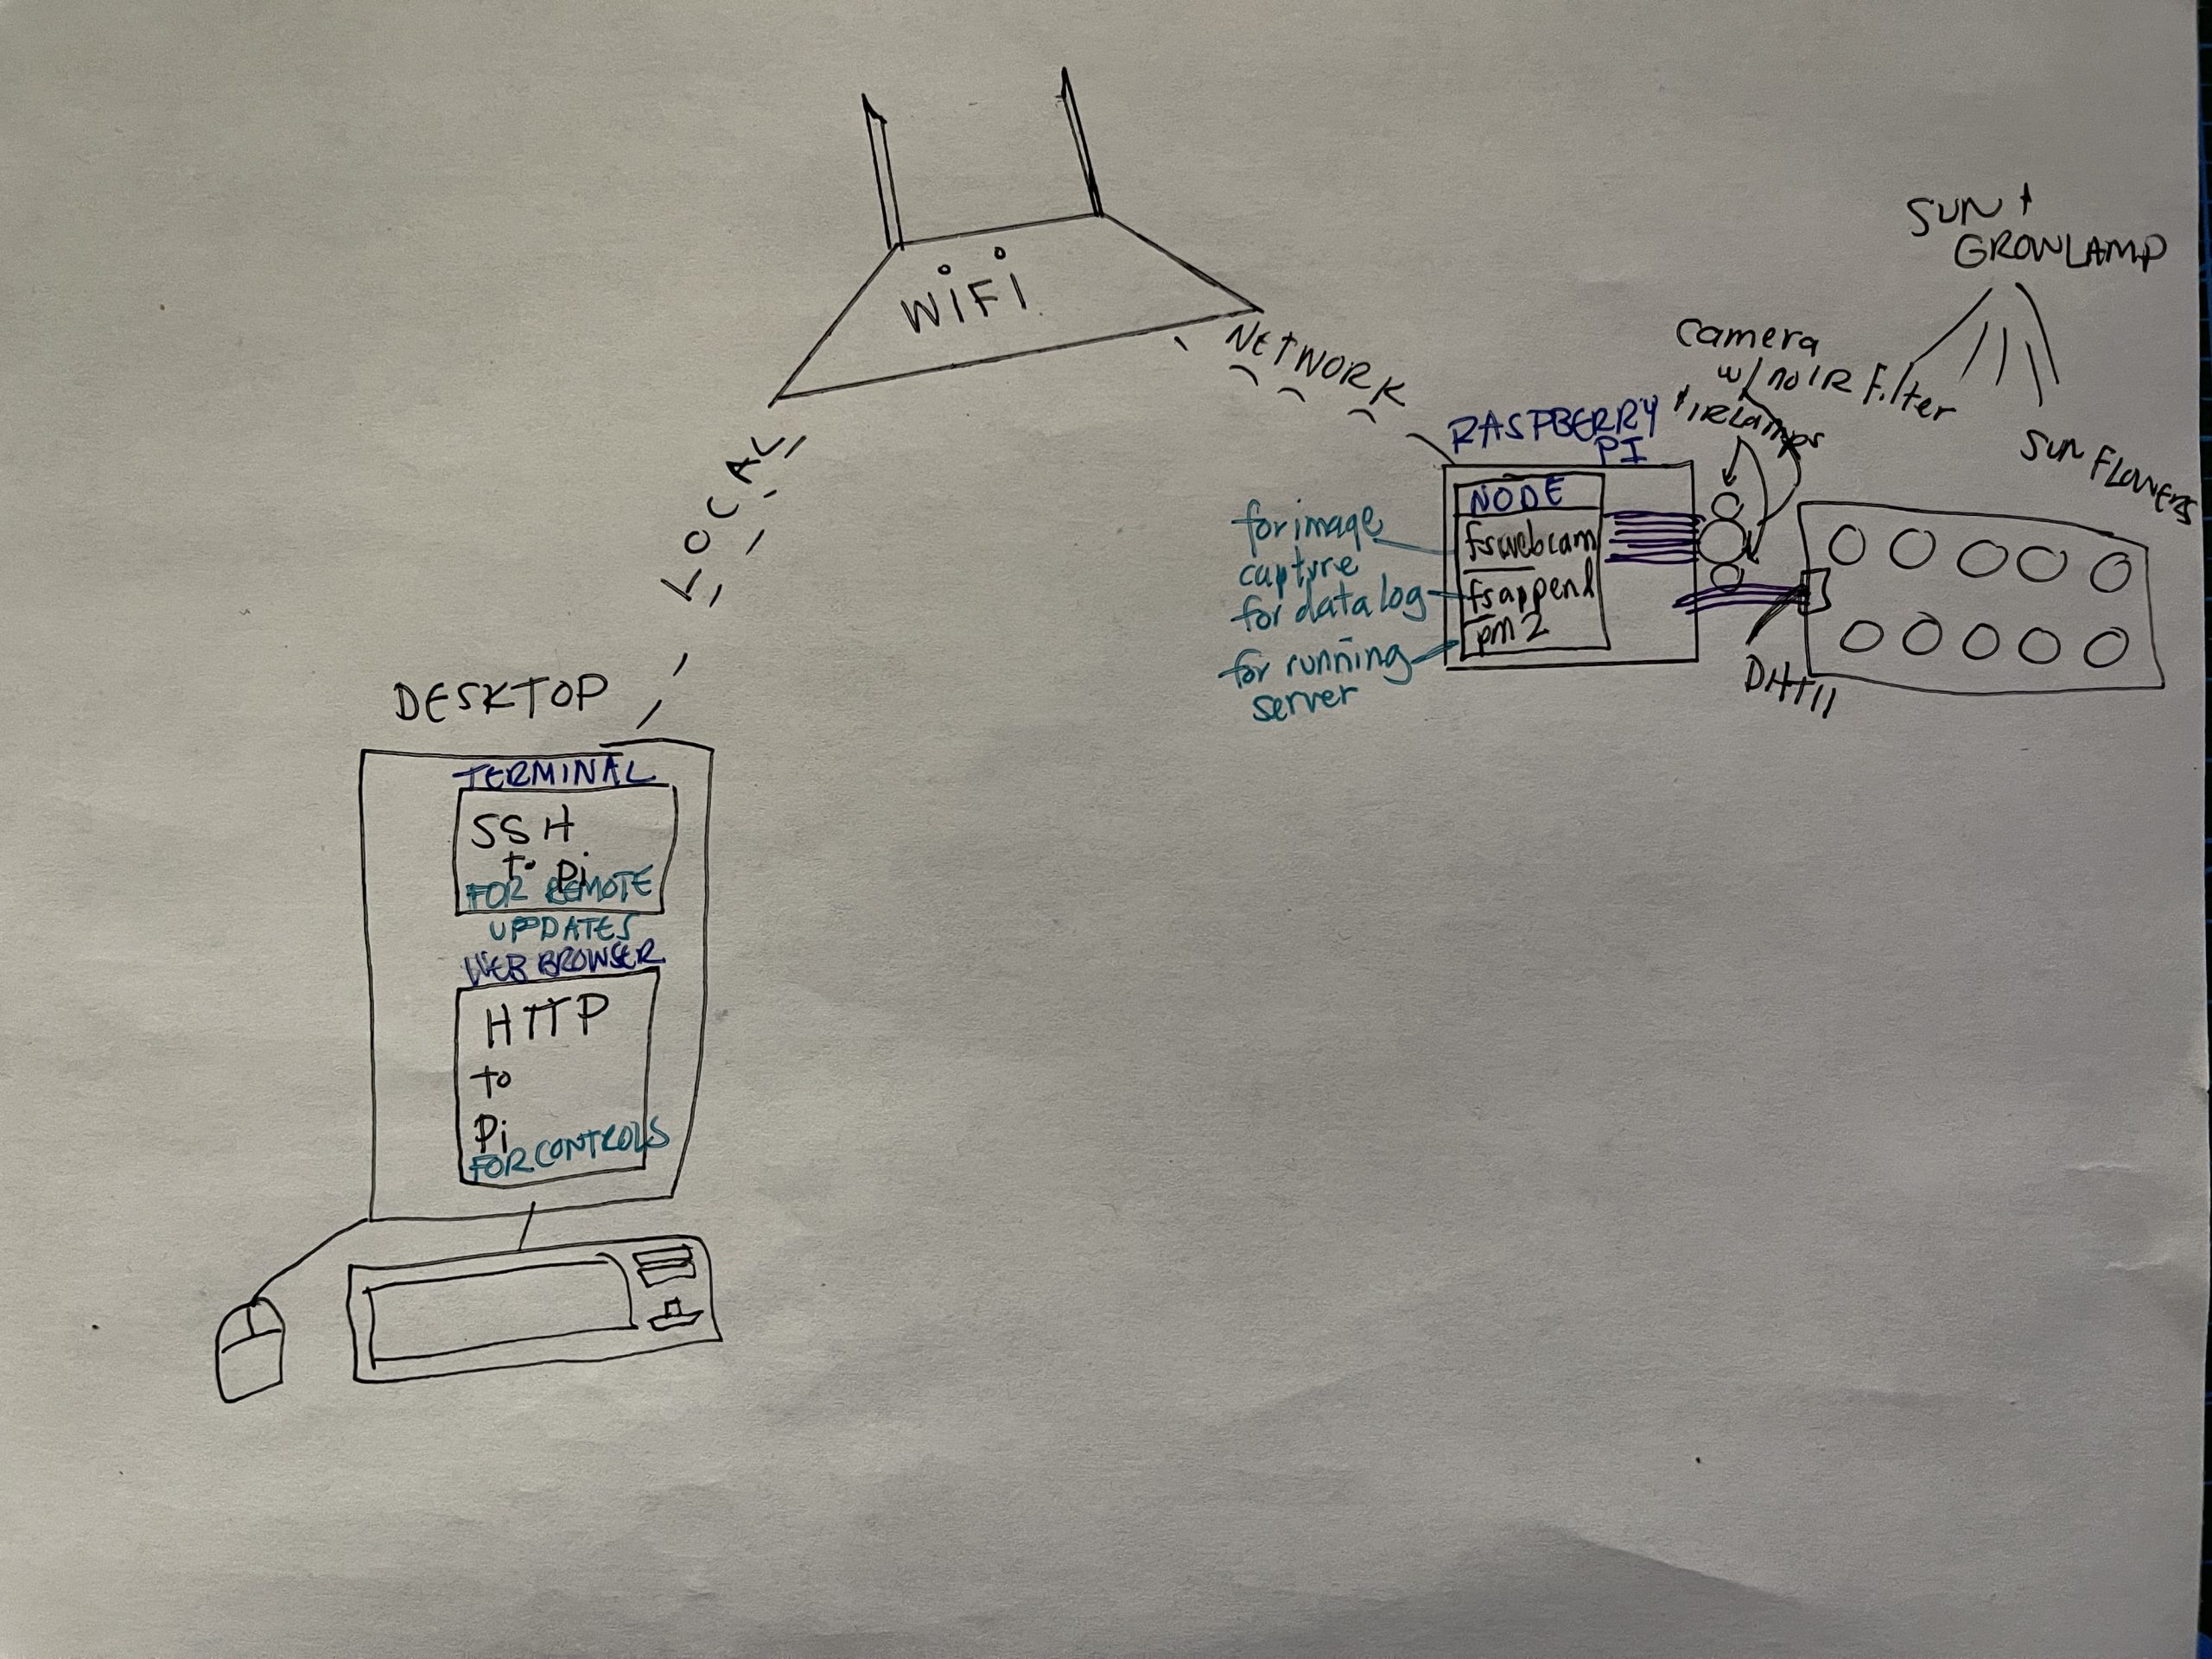
The green block in the middle of the image, hanging on the side of the planter tray is a micro breadboard that, on the other side, has a DHT11 (a very common sensor for reading temperature and humidity.) While I initially set up the project using a connected monitor, keyboard, and mouse, I was able to program the DHT11 remotely–adding the code to the server ENTIRELY using the terminal interface on my Mac. I even downloaded all the files used in this time lapse via ‘scp’.
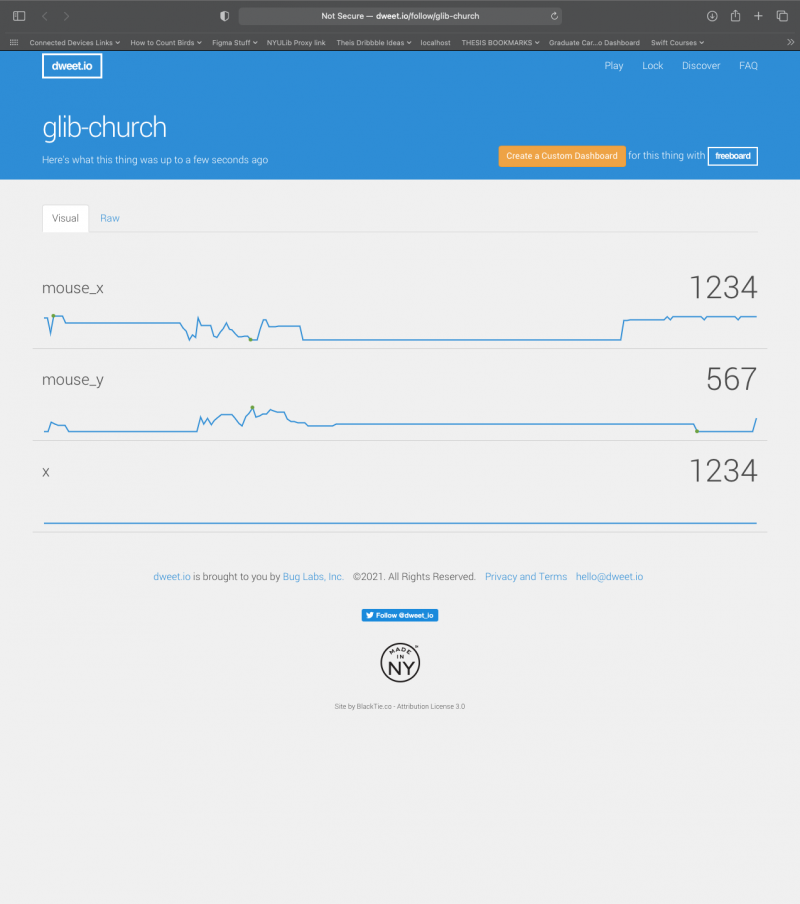
The way this project worked was that I used a web browser interface that controlled a Raspberry Pi recipe I followed to run a server that prompts the camera to take a series of images that could made into a time-lapse video.
Unfortunately, whenever the browser reloaded, there was good potential for things to go not as planned. The problem I had involved browser tabs I left open with the control panel that would refresh, and reset the setting to a default of 60 seconds between images, so for part of the video–while frames may be moving at the same speed, the images in the frame were taken much closer together than the rest of the images (1 min vs 5 min apart.) Interestingly deceptive, though you will notice that the day seems to go on longer than others.
Also, there was the occasional server crash if you notice a jump in time and lighting.
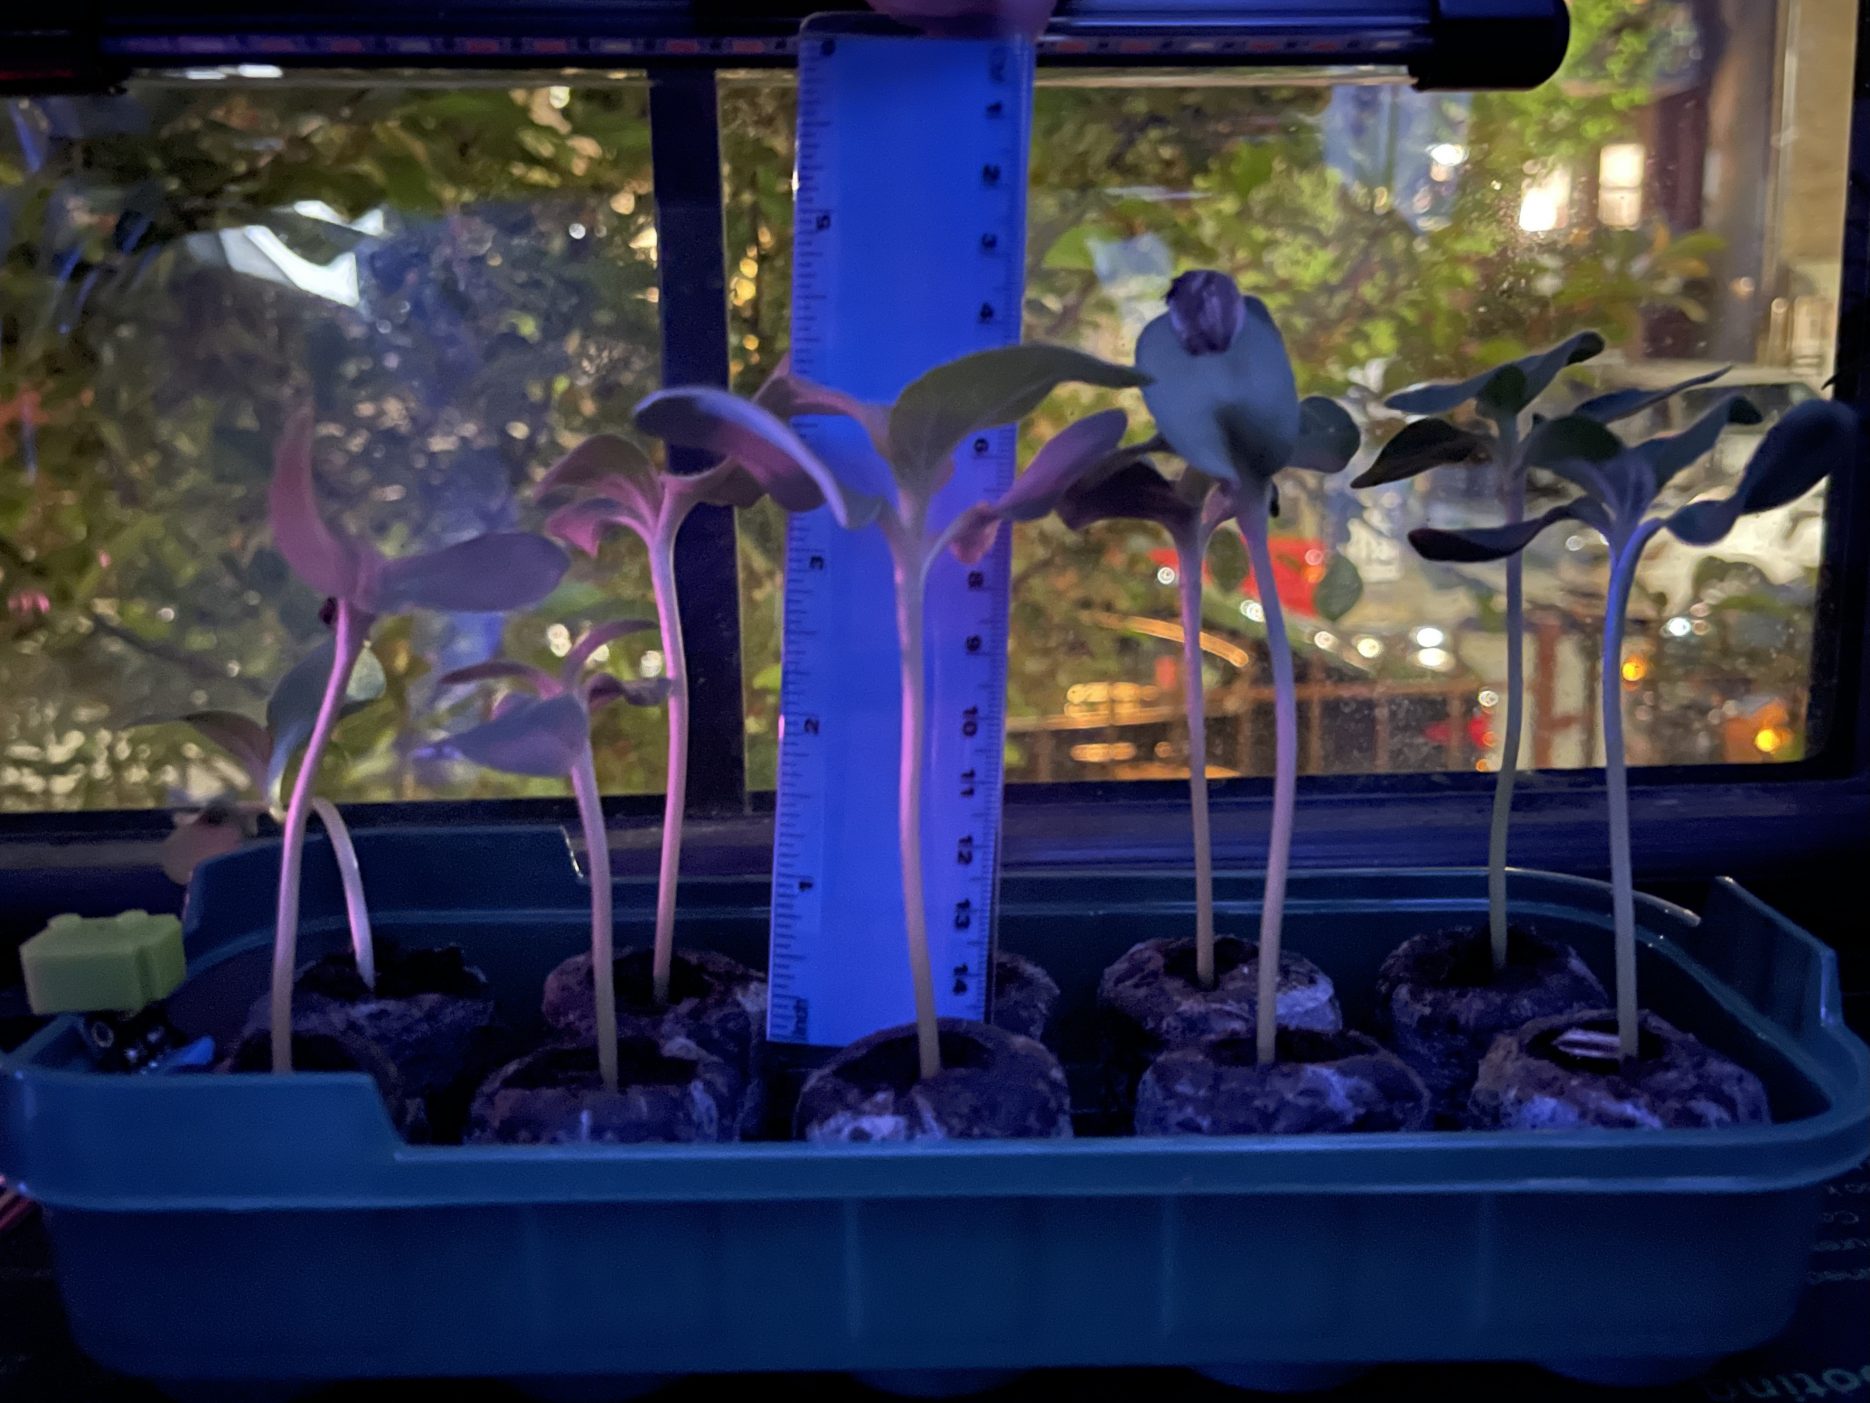
A couple more notes: you’ll notice a red-light quickly flash, that’s likely caused from a vehicle parked outside the front of my building for a long time. Also, on the last day, I tried adding a green Post-It note ruler I made, but it wasn’t visible, so I took it out.
Ideas for Similar Future Projects

One thing I would do differently on a similar future project is mark down when I watered the plants and opened (and left open) the window above the setup. I’m not quite sure why the humidity increased at times when it did… I tried playing with it in Excel, but couldn’t spot anything consistent. I can speculate that it probably increased when I watered it, every one or two days—these guys grow fast and need lots of water. (It *is* crazy to think I just put a seed in some peat, added some water and light, and, now, LIVING things a few inches tall sprouted up in the last week!) I also think that it’s likely that when the sun would hit the seedling tray, it caused some evaporation.
Another thing I noticed was that, quite a few times, the DHT11 would show temperatures around 100ºF. I wondered what that might be caused by. My first thought was that it would likely be similar to when you’ve parked your car in the sun on a cool day and your dash says it’s scorching… direct sunlight on the sensor (or sensor board) was giving augmented readings.
So, Friday evening, I decided I would do one last thing to enhance my project—as, surely, in all the sensors in my 48-in-1 Keystudio Sensor Kit, there would be a light/photoresistor sensor I could use the last day of my project. There were actually two light sensors—a photoresistor sensor board and an ambient light sensor (TEMT6000). I got really excited by the thought of adding them to my project by plugging in a few wires then doing my awesome hacker-remote programming trick I did for the DHT11. Unfortunately, I came across a bit of a roadblock.
It turns out that both the TEMT6000 and the photoresistor sensor are analog and the Raspberry Pi needs a digital to analog converter to be able to use such sensors in the way they were meant. I found out that there was the potential to add the sensor to the project, but, as the Pi is digital, it would only give me an off/on reading… and not only would it take some testing to see what that trigger point was, but it wouldn’t really even give me the info I wanted—whether or not the high temperature readings were appearing when sunlight was shining on the DHT11.
I wondered how I could figure this out… not wanting to just add a whatever sensor to my project to say I added it. Was there a combination of sensors that I could use to get (close to) the info I wanted to know… turns out, one of the most valuable ITP lessons I’ve learned came in handy; I took a step back to ask myself if I was OVER thinking this. I was: I had data already that could help me figure that out—PICTURES.

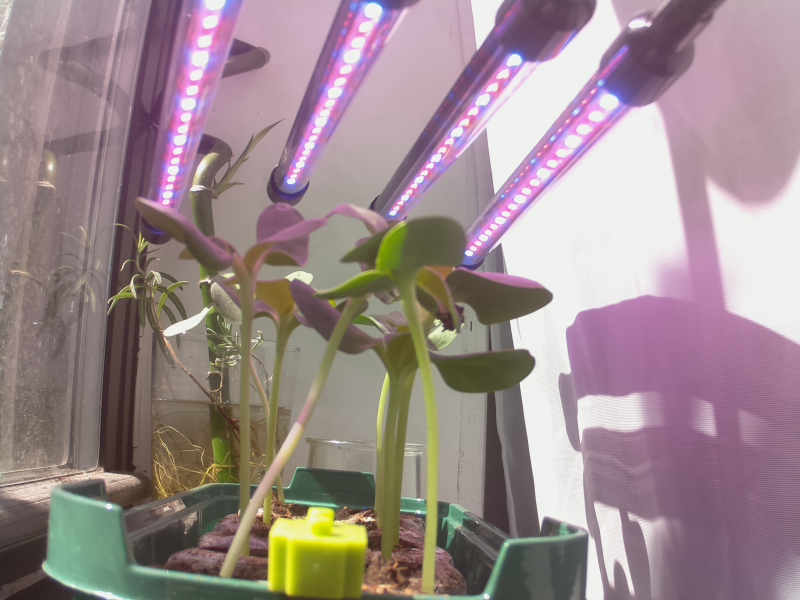
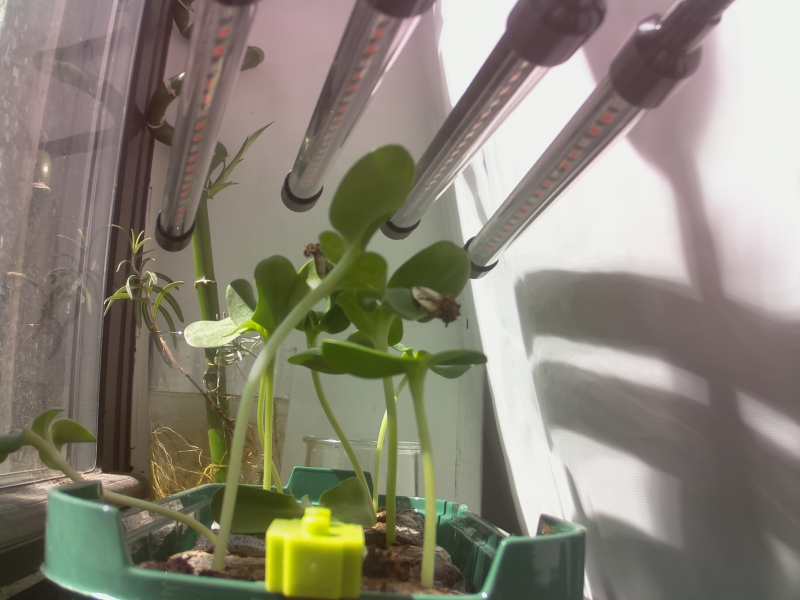
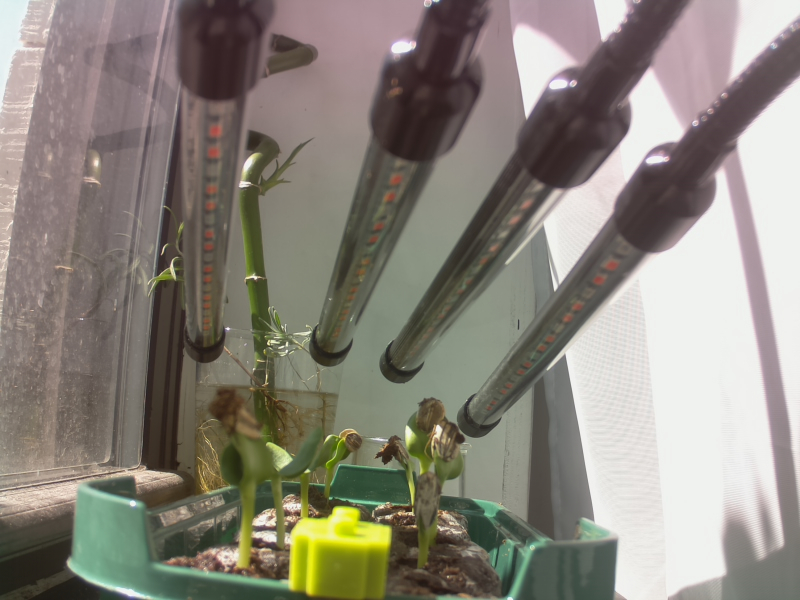
So I was able to look through the temperatures and correlated images to find that, indeed, there appeared to be a correlation. I sorted the highest temperatures and the highest temperatures from the 3 days with the highest temps were all around the same time and the images definitely showed a sun glare. Here they are:
Another takeaway—more a reminder than lesson—from this exercise in avoiding over-complication, the platform (and understanding it) and components (and understanding them) you choose matter. Interestingly, the 48-in-1 Kit I got was advertised as Raspberry Pi and Arduino friendly; however, when you find your way to the reference material (broken link), it only shows information on projects for Adruino/compatible boards. It took me a bit to figure out I had ‘pieces that don’t work together without an intervention.’ I realize I’ve just been kind of dipping my toe into working with the Raspberry Pi in the last 6 months, but it does point out the fact that, even on the smallest project, taking into account compatibility in your planning can make a difference.
Here is a link to my datalog that includes all the times that the function to capture an image was run—this matters because the datalog was updated even when the camera malfunctioned and did not take a picture.